In the stock price analysis, we have seen the analysis of gain probability by computing its likelihood of making a gain in the selected period. In this trend analysis page, we extend the analysis further by looking at each day's price, especially the down days', to measure its significance — "if I see a price dip, how big a dip it was?"
Price time span
Price time span is a way to analyze one day's close in the context
of both in the history and in the future.
Last lower
First, we search into the history for a price lower than this price, then counting the days between the two dates. This value represents the last time I have seen a price lower than this. We call this the last lower. Now imagine a day when AAPL went down, was $5, or 5% a lot? Should I buy this dip? The last lower value, say, 30, would mean that this dip just put AAPL back to its 30 day's ago. Therefore, if you had bought it 30 days back and held till this moment, you would have gained zero.
This value is useful if you are more accustomed to think in term of time than of $5 or 5% return. It is translating that $5 into a time-based measure.
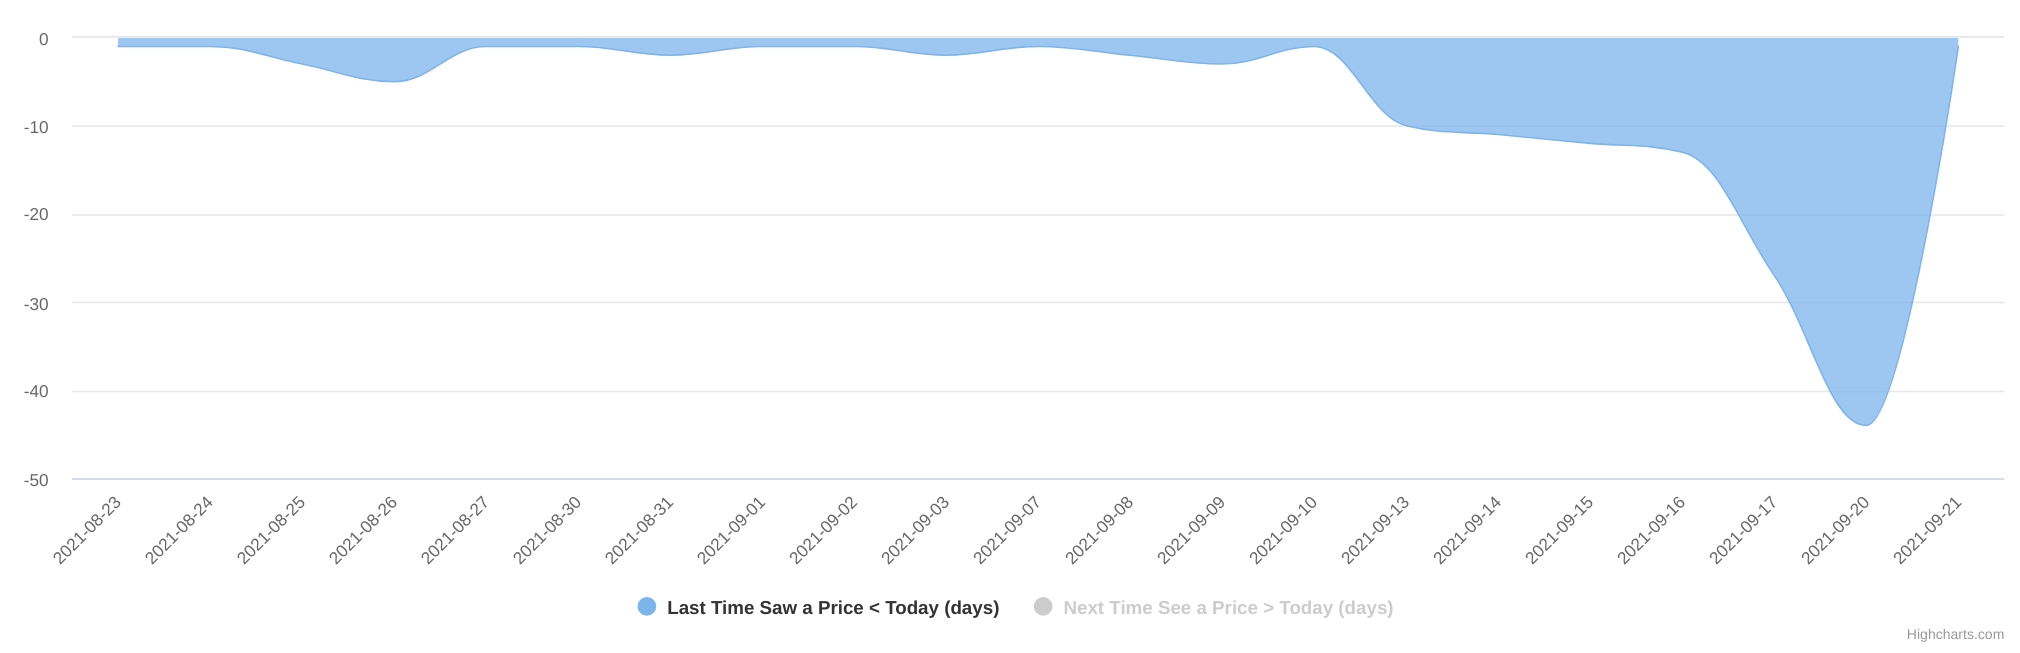
In this example, AAPL lost 40 days' worth of ground on 9/20/2021, and clearly you could see the negative trend became larger and larger starting 9/13.
Next better
Inverse to the last lower, we now turn our lens into the future when standing on a date. The next better is to count days between this date and the next price higher than me. If the stock is on a rising trend, this value would always be 1, meaning you see a higher price on the next day. Similarly, a 0 is the day when the price peaked out because we can't any higher price, and a large value is the time it took while for the stock to recover.
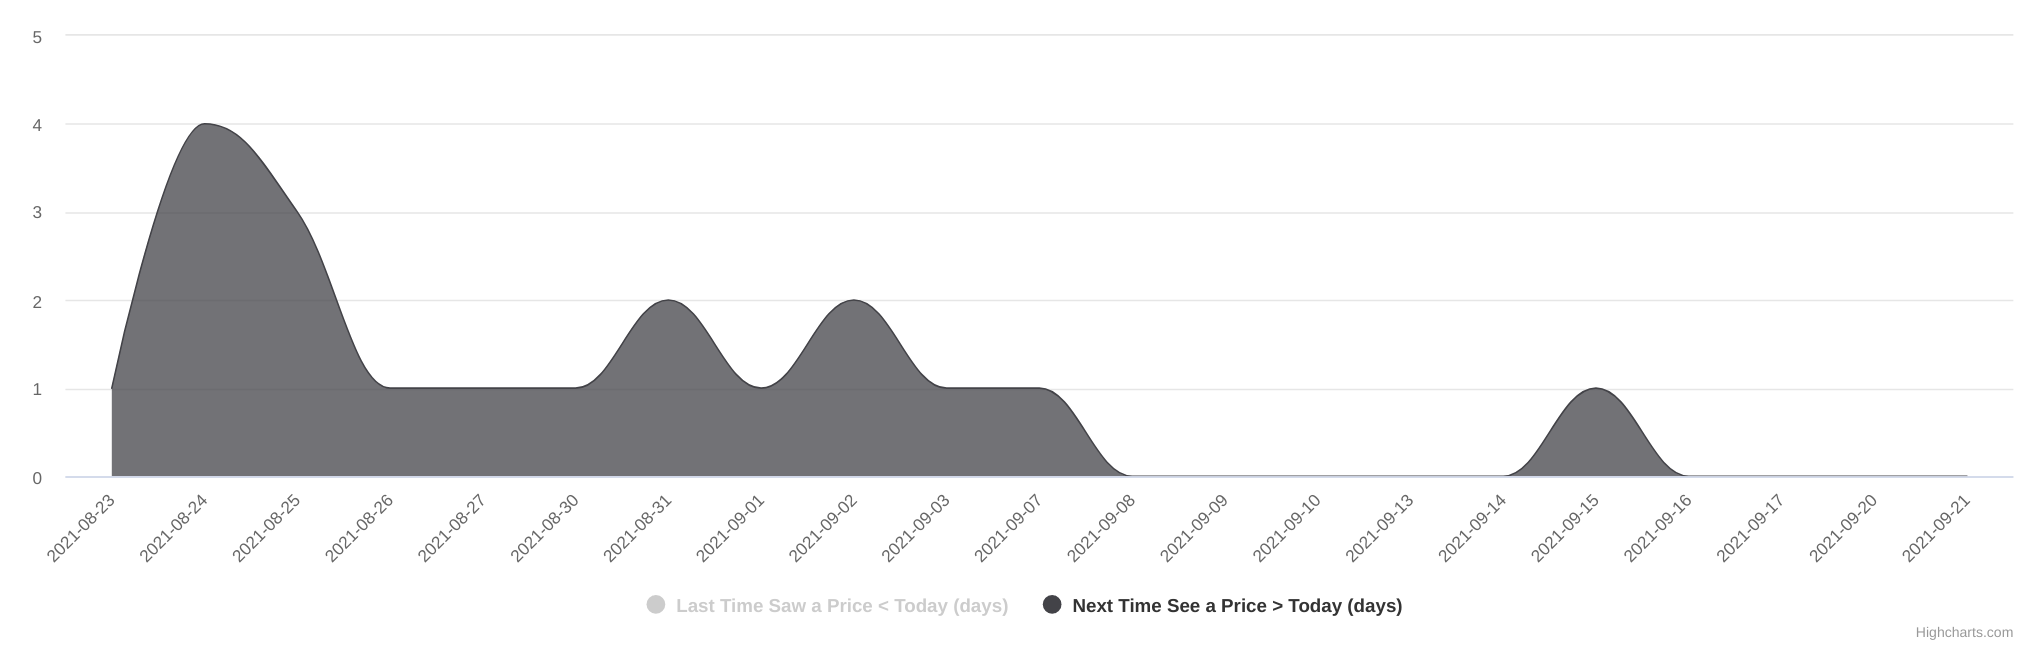
So to sum it up, these two are measuring a price's significance in term of time, thus highlight a stock's price trend.
| last lower | next better | |
|---|---|---|
| 0 | at bottom, or continuously rising | at peak, or continously falling |
| 1 or -1 | reverse previous trend | reverse previous trend |
| large value | significant drop | slow recovery |
Gain bought today & hold
Gain bought today & hold is an evaluation if you were to buy at the
day's close price1 and hold till the end of the selected
period. The gain = (last close today's close)/today's close.
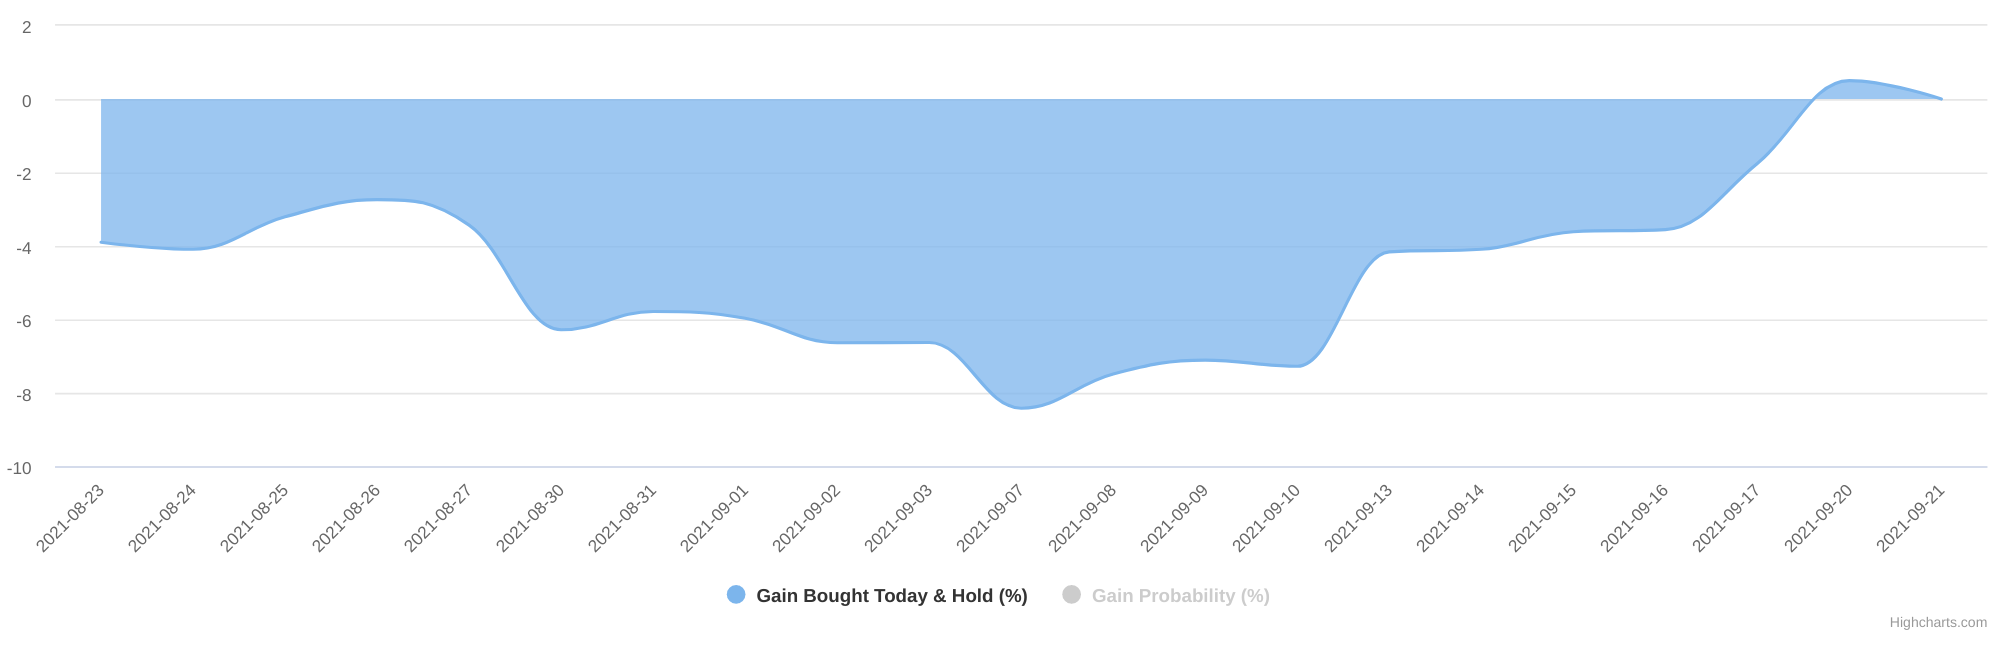
In this example, AAPL would have rendered most of the days a loss if
you had invested because its last close price was low. The larger
the negative area, the more significant the difference is between its
high price points and low price points.
Inversely, one could imagine that area would be in the positives if stock had a rising week.
Daily gain probability
This is a sibling analysis of the gain probability ranges on the
stock price view. Instead of a range, we present a day-by-day
view of how a gain probability will change over time, thus
highlighting a moving trend of this value.
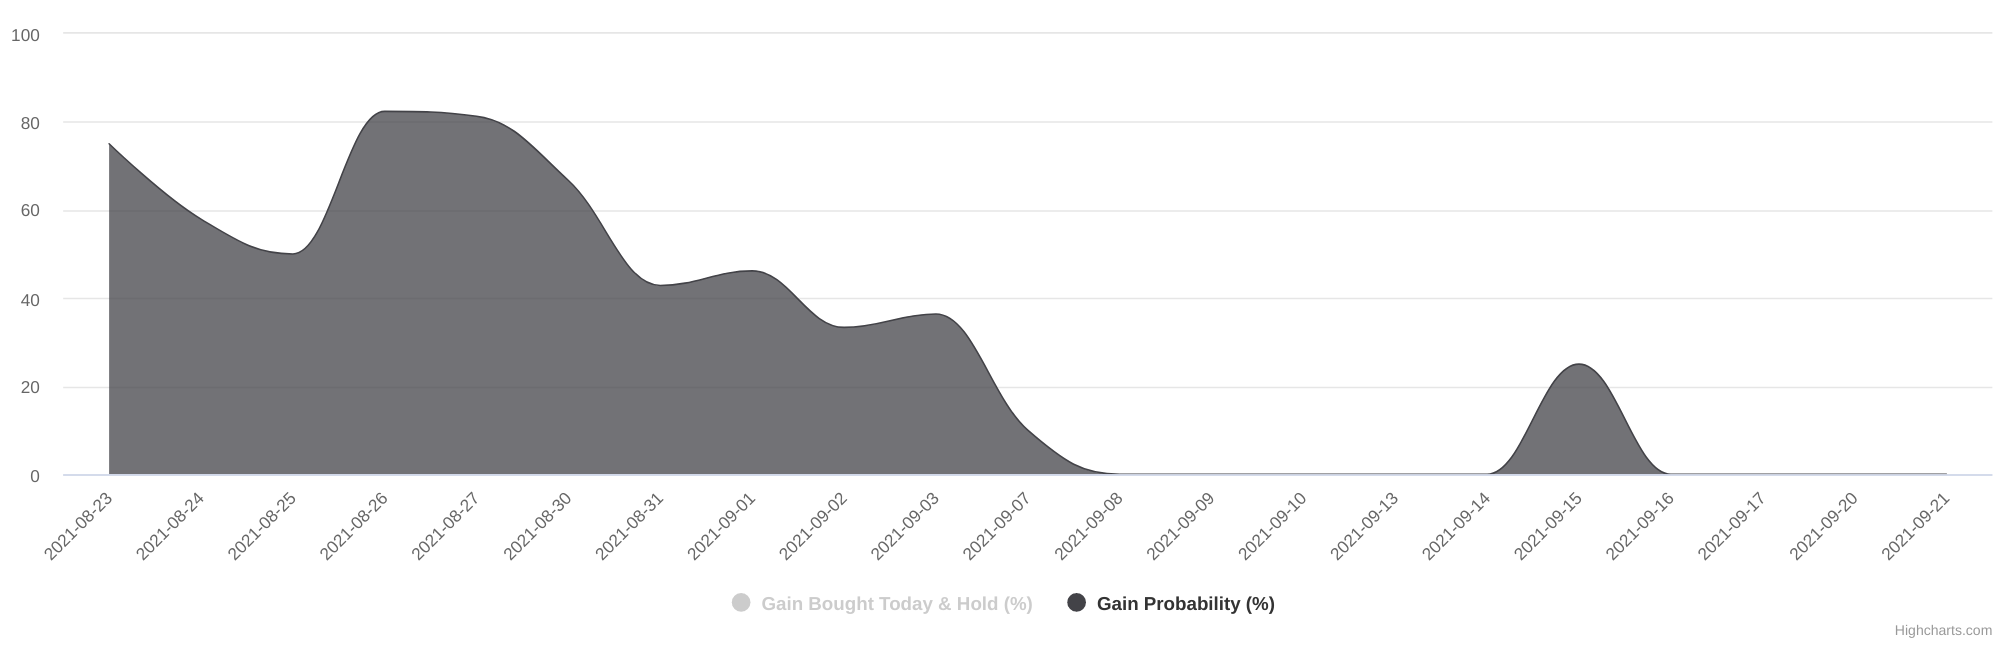
In this example, AAPL had good gain probability at the start,
indicating the price then was good. However, the probability shrank
because price started rising. On 9/8 it reached 0, meaning the close
was the peak for its remaining days. Then it started its decline. On
9/16 it had a good open, the only one in the last 4 days. This made
the close price on 9/15 having a 25% chance of making a gain.
-
The
closeprice was chosen rather arbitrarily. We have no assumption of someone's trading habit — whether he likes to buy at market opening, or close, or in between. Therefore, the analysis demonstrates the power of the tool and what it can deliver. Choosing a different price point for the calculation will be addressed by future features. ↩
— by Feng Xia